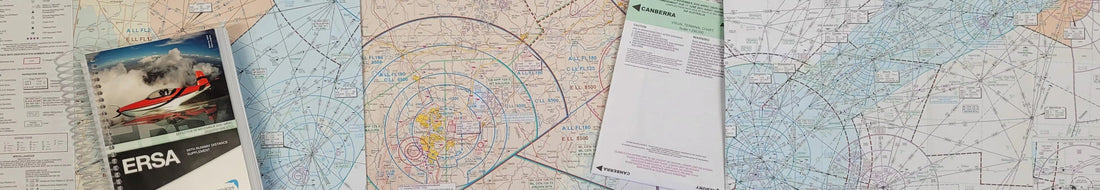
Airservices Charts
Which chart is right for me?
For VFR Operations:
Visual Terminal Charts (VTC)
VTC provides both aeronautical and topographical information at a scale of 1:250,000 for VFR operations in the vicinity of major aerodromes. In some cases, VTC shows detail of tracks to be flown and significant landmarks which are used by pilots of VFR aircraft to avoid inadvertent penetration of controlled airspace.

Visual Navigation Charts (VNC)
VNC will help you plan your flight in relation to controlled airspace, transition from the WAC to the VTC when operating around terminal areas, and navigate when nearing controlled Airspace or Restricted and Danger Areas. Topographical information at a scale of 1:500,000.

World Aeronautical Charts (WAC)
These Australian charts are part of the ICAO 1:1,000,000 international series. Designed for pre-flight planning as well as pilotage, WAC are constructed using Lambert's conformal conic projection and conform to ICAO specifications. WAC charts generally do not show much aeronautical data. Only aerodrome names and locations, and restricted / danger areas are included.

For IFR Operations:
Enroute Charts (ERC) Low (L)
ERC (L) are drawn to various scales to accommodate significant air traffic route areas and show controlled airspace, prohibited, restricted and danger areas, air routes, ATS and radio-navigation services.

Enroute Charts (ERC) High (H)
ERC (H) are designed to provide selected information similar to that of ERC (L) series and are primarily for use by aircraft operating on transcontinental and intercapital routes at FL200 and above.

Terminal Area Charts (TAC)
For use in terminal areas, TAC provides airspace, air-routes, prohibited, restricted, and danger areas, navigation aids and radio frequencies. They are designed to display aeronautical information at a larger scale for easier use in congested areas. Scale varies for each chart.

For General Planning:
Planning Chart Australia (PCA)
PCA contains meteorological Area Forecast boundaries and locations, communication coverage outside controlled airspace and WAC coverage.
Checking Validity
Each chart will have a cover page with a specified validity. Charts are updated every 6 months and must be current. Each new edition also has a different colour to help differentiate them apart.

Legend
Each chart will have a multitude of different icons, symbols, colours and lines. If you are unsure of what they mean, you can refer to the legend. Each chart may have a slightly different legend.
